Tutorial 3: Raw Image Loading
Before starting, make sure that instances of pygid.ExpParams and pygid.CoordMaps have been successfully created (see Tutorial 1 and Tutorial 2).
from pygid.datasets import get_dataset

# Download example dataset from Zenodo
try:
    files = get_dataset("tutorial_03")
    poni_path = files["poni_for_tiff"]
    # several files for batch processing
    data_path1 = files["data1_tiff"]
    data_path2 = files["data2_tiff"]
    data_path3 = files["data3_tiff"]
except:
    print("Dataset download skipped on Read the Docs.")
Dataset download skipped on Read the Docs.
import pygid

params = pygid.ExpParams(
    poni_path=poni_path,          # path to the PONI file
    ai=0.01                       # angle of incidence (degrees)
)

matrix = pygid.CoordMaps(
    params  # pygid.ExpParams
)
After creating the pygid.CoordMaps instance, raw detector images can be loaded. You can provide either the path to a raw data file (or list of files) or a 2D/3D numpy array.
Load Image from File (EDF, TIFF, CBF)
Single file:
analysis = pygid.Conversion(
    matrix=matrix,                   # pygid.CoordMaps
    path=data_path1                  # path to the raw data file
)
print(f"raw data shape {analysis.img_raw.shape}")
raw data shape (1, 2048, 2048)
Multiple files:
analysis = pygid.Conversion(
    matrix=matrix,
    path=[data_path1, data_path2, data_path3] # several files
)
print(f"raw data shape {analysis.img_raw.shape}")
raw data shape (3, 2048, 2048)
Note: If the number of images exceeds batch_size, batch processing mode activates (see Tutorial 8).
Load Dataset from File (HDF5, NXS)
HDF5 and NXS files can contain multiple images with internal structure.
Specify the dataset path (e.g., 'measurement/eiger4m') and the frame number (frame_num):
None– load all imagesint– load a single framelist– load a list of frames
from pygid.datasets import get_dataset

# Download example dataset from Zenodo
files = get_dataset("tutorial_03")
poni_path = files["poni_for_h5"]
mask_path = files["mask_for_h5"]
# several files for batch processing
data_path = files["data_h5"]
import pygid

params = pygid.ExpParams(
    poni_path=poni_path,          # path to the PONI file
    mask_path=mask_path,
    ai=0.01,                       # angle of incidence (degrees)
    fliplr=True,
    flipud=True
)

matrix = pygid.CoordMaps(
    params  # pygid.ExpParams
)
Load all frames from the dataset:
analysis = pygid.Conversion(
    matrix=matrix,                   # pygid.CoordMaps
    path=data_path,                  # path to the raw data file
    dataset='/entry_0000/ESRF-ID10/eiger4m/data'  # dataset path
)
print(f"raw data shape {analysis.img_raw.shape}")
raw data shape (13, 2162, 2068)
Load a specific frame from the dataset:
analysis = pygid.Conversion(
    matrix=matrix,                   # pygid.CoordMaps
    path=data_path,                  # path to the raw data file
    dataset='/entry_0000/ESRF-ID10/eiger4m/data',  # dataset path
    frame_num = 7,
)
print(f"raw data shape {analysis.img_raw.shape}")
raw data shape (1, 2162, 2068)
Load several frames from the dataset:
analysis = pygid.Conversion(
    matrix=matrix,                   # pygid.CoordMaps
    path=data_path,                  # path to the raw data file
    dataset='/entry_0000/ESRF-ID10/eiger4m/data',  # dataset path
    frame_num = [5,6,7],
)
print(f"raw data shape {analysis.img_raw.shape}")
raw data shape (3, 2162, 2068)
Pass the Loaded Image (numpy.array)
If the image is already loaded, pass it using the img_raw parameter. Supports:
2D numpy array
3D numpy array (axis 0 = frames)
Orientation must match the mask and PONI coordinates.
import h5py
with h5py.File(data_path, mode='r') as root:
    img_raw = root['/entry_0000/ESRF-ID10/eiger4m/data'][()]
analysis = pygid.Conversion(
    matrix=matrix,                   # pygid.CoordMaps
    img_raw = img_raw
)
print(f"raw data shape {analysis.img_raw.shape}")
raw data shape (13, 2162, 2068)
Other Parameters
average_all/sum_all– average or sum all framesnumber_to_average/number_to_sum– partial averaging or sumroi_range=[y_min, y_max, x_min, x_max]– select region of interest (in pixels of raw image before flipping/rotation)
analysis = pygid.Conversion(
    matrix=matrix,
    path=data_path,
    dataset='/entry_0000/ESRF-ID10/eiger4m/data',  # dataset path
    average_all=True,
    sum_all=False,
    roi_range=[0, 500, 0, 500]
)
print(f"raw data shape {analysis.img_raw.shape}")
raw data shape (1, 500, 500)
analysis = pygid.Conversion(
    matrix=matrix,
    path=data_path,
    dataset='/entry_0000/ESRF-ID10/eiger4m/data',  # dataset path
    number_to_sum=5,
)
print(f"raw data shape {analysis.img_raw.shape}")
WARNING - 3 images left, averaging them separately.
raw data shape (3, 2162, 2068)
After loading, images are preprocessed: masked, flipped (from ExpParams), and normalized using intensity correction matrices (CoordMaps).
Any other manipulations with raw data can be done using analysis.img_raw (such as normalization or background subtraction). The shape of the raw data is (n_frames, n_rows, n_cols).
analysis.img_raw[0]/=2
Visualization of Raw Images
Plot images in detector pixel positions (0,0 = direct beam).
Ensure Detector_config==3. Orientation of PONI, mask, and raw image must match.
Parameters
frame_num– frame to plot (int)clims–(vmin, vmax)for color scalereturn_result– return(x, y, img)ifTrueplot_result– display the plot (True/False)xlim,ylim– axis limits, e.g.,(0, 500)save_fig– save the figure (True/False)path_to_save_fig– path to save figure, default"img.png"
analysis = pygid.Conversion(
    matrix=matrix,                   # pygid.CoordMaps
    path=data_path,                  # path to the raw data file
    dataset='/entry_0000/ESRF-ID10/eiger4m/data'  # dataset path
)

x, y, img = analysis.plot_img_raw(
    frame_num=7,
    clims=(4e2,1e5),
    return_result=True,
    plot_result=True,
    save_fig=False,
    path_to_save_fig="img.png"
)

print(f"x-axis shape {x.shape}")
print(f"y-axis shape {y.shape}")
print(f"raw image shape {img.shape}")
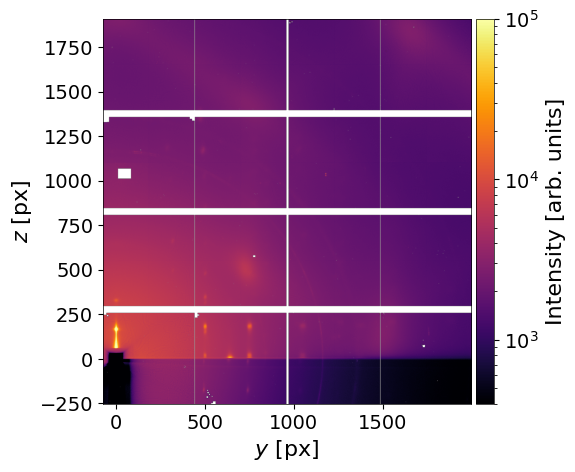
x-axis shape (2068,)
y-axis shape (2162,)
raw image shape (2162, 2068)
How to change the plotting defaults (colormap, font size, etc.) is described in Tutorial 12.