Tutorial 5: Line Profiles
pygid supports several functions for line profiling of intensity:.
Table 2. Conversion line profile functions
Function Name |
Output Data Name |
Axes Name |
Description |
|---|---|---|---|
|
|
|
Makes polar remapping and averages in the given angular range (GID geometry) |
|
|
|
Makes polar remapping and averages in the given angular range (transmission geometry) |
|
|
|
Makes polar remapping and averages in the given radial range (GID geometry) |
|
|
|
Makes polar remapping and averages in the given radial range (transmission geometry) |
|
|
|
Makes cylindrical remapping and averages in the given $q_z$ range (GID geometry) |
Note: In this tutorial, only GID geometry described. All other line profiling functions use the same parameters and workflow.
Load datasets from Zenodo, and create params, matrix, and analysis instances as described in Tutorials 1–3.
from pygid.datasets import get_dataset

# Download example dataset from Zenodo
try:
    files = get_dataset("tutorial_05")
    poni_path = files["poni"]
    mask_path = files["mask"]
    # several files for batch processing
    data_path = files["data"]
except:
    print("Dataset download skipped on Read the Docs.")
Dataset download skipped on Read the Docs.
import pygid

# create pygid.ExpParams based on the PONI file
params = pygid.ExpParams(
    poni_path=poni_path,          # path to the PONI file
    mask_path=mask_path,
    ai=0.01,                       # angle of incidence (degrees)
    fliplr=True,
    flipud=True
)

# create pygid.CoordMaps based on pygid.ExpParams
matrix = pygid.CoordMaps(
    params  # pygid.ExpParams
)

# load the data from file
analysis = pygid.Conversion(
    matrix=matrix,                   # pygid.CoordMaps
    path=data_path,                  # path to the raw data file
    dataset='/entry_0000/ESRF-ID10/eiger4m/data'  # dataset path
)
print(f"raw data shape {analysis.img_raw.shape}")
raw data shape (13, 2162, 2068)
Minimal Code Example
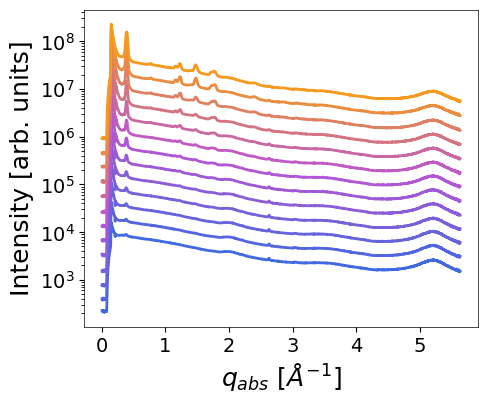
# Radial profile
q, intensity = analysis.radial_profile_gid(
plot_result=True,
return_result=True)
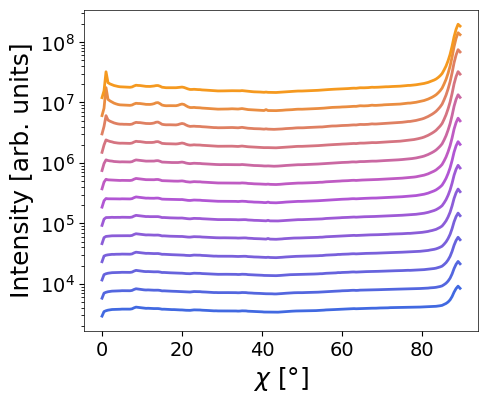
# Azimuthal profile
chi, intensity = analysis.azim_profile(
plot_result=True,
return_result=True)
Parameters (for all remapping functions)
Main parameters:
frame_num– index or list of indiced of loaded frames to convert (not the frame number in file). IfNone, all loaded images are converted.return_result– ifTrue, returns converted image and axes arrays. Default isFalse.multiprocessing– flag to enable multiprocessing. IfNone, uses the default defined in theConversionclass.radial_range- radial range range (tuple, in Å⁻¹)angular_range- angular range range (tuple, in degrees)q_xy_range- q_xy range (tuple, in Å⁻¹) for horiz_profile_gid() functionq_z_range- q_z range (tuple, in Å⁻¹) for horiz_profile_gid() functiondang– angular bin size (degrees).dq– radial bin size (Å⁻¹).
Saving parameters:
save_result– whether to save the result as an HDF5 file in NXsas format.path_to_save– output path for the HDF5 result file.h5_group– name of the NXentry dataset within the HDF5 file.overwrite_file– ifTrue, overwrites existing HDF5 file. Default isTrue.overwrite_group– ifTrue, overwrites existing NXentry group. Default isTrue.exp_metadata–ExpMetadatainstance containing experimental information (see Tutorial 6).smpl_metadata–SampleMetadatainstance containing sample information (see Tutorial 6).
Plotting parameters:
return_fig- whether to returnfig,axplot_result– whether to plot the remapped image.xlim,ylim– tuples defining X and Y axis limits for the plot.save_fig– whether to save the plotted image to a file.path_to_save_fig– path to save the plot (e.g..png,.tiff).shift– vertical offset applied to separate multiple plotted curves.
Radial profile
q, intensity = analysis.radial_profile_gid(
    frame_num=None,                   # Frame(s) to analyse; all if None
    radial_range=(0.25, 2.5),              # Radial q-range in Å⁻¹
    angular_range=(0, 90),            # Angular range in degrees
    dang=0.5,                         # Angular resolution (degrees)
    dq=None,                          # Radial bin width (Å⁻¹)
    return_result=True,               # Return computed q and intensity
    save_result=True,                 # Save result to HDF5
    path_to_save="result.h5",         # Output path
    h5_group="entry_radial",                    # Group name in HDF5
    overwrite_file=True,             # Overwrite HDF5 file
    overwrite_group=False,            # Overwrite NXentry group
    plot_result=True,                 # Plot the radial profile
    shift=1,                        # Vertical offset between curves
)

print(f"q_abs shape {q.shape}")
print(f"intensity profiles shape {intensity.shape}")
INFO - Saved in D:\PhD\mlgid\pygid\docs\tutorials\result.h5 in group entry_radial
q_abs shape (969,)
intensity profiles shape (13, 969)
Result: 13 radial profiles were saved in “result.h5” in a single entry entry_radial
chi, intensity = analysis.azim_profile_gid(
    frame_num=None,                   # Frame(s) to analyse; all if None
    radial_range=(1.4, 1.6),          # Radial q-range in Å⁻¹
    angular_range=(10, 90),           # Angular range in degrees
    dang=0.5,                         # Angular resolution (degrees)
    dq=None,                          # Radial bin width (Å⁻¹)
    return_result=True,               # Return computed q and intensity
    save_result=True,                 # Save result to HDF5
    path_to_save="result.h5",         # Output path
    h5_group="entry_azim",            # Group name in HDF5
    overwrite_file=True,              # Overwrite HDF5 file
    overwrite_group=False,            # Overwrite NXentry group
    plot_result=True,                 # Plot the radial profile
    shift=0.2,                        # Vertical offset between curves
)

print(f"chi shape {chi.shape}")
print(f"intensity profiles shape {intensity.shape}")
INFO - Saved in D:\PhD\mlgid\pygid\docs\tutorials\result.h5 in group entry_azim
chi shape (160,)
intensity profiles shape (13, 160)
Result: 13 azimuthal profiles were appended to “result.h5” as separate entry entry_azim
NOTE: a new conversion overwrites the result of previous conversion in memory
How to change the plotting defaults (font size, etc.) is described in Tutorial 12.