Tutorial 12: Raw and Processed Data Visualization
As mentioned before, raw and processed images, as well as line profiles and simulated peaks, can be visualized using the pygid.Conversion class. This tutorial demonstrates how to change the default plotting parameters.
from scipy.stats import reciprocal

from pygid.datasets import get_dataset

# Download example dataset from Zenodo
try:
    files = get_dataset("tutorial_03")
    poni_path = files["poni_for_tiff"]
    # several files for batch processing
    data_path = files["data1_tiff"]
except:
    print("Dataset download skipped on Read the Docs.")
Dataset download skipped on Read the Docs.
Load the PONI file, raw data and create the pygid.CoordMaps instance.
import pygid

params = pygid.ExpParams(
    poni_path=poni_path,          # path to the PONI file
    ai=0.01,                       # angle of incidence (degrees)
    flipud=True
)

matrix = pygid.CoordMaps(
    params  # pygid.ExpParams
)

analysis = pygid.Conversion(
    matrix=matrix,                   # pygid.CoordMaps
    path=data_path                 # path to the raw data file
)
Visualization of Raw Images
Plot images in detector pixel positions (0,0 = direct beam).
Parameters
frame_num– frame to plot (int)clims–(vmin, vmax)for color scalereturn_result– return(x, y, img)ifTrueplot_result– display the plot (True/False)xlim,ylim– axis limits, e.g.,(0, 500)save_fig– save the figure (True/False)path_to_save_fig– path to save figure, default"img.png"
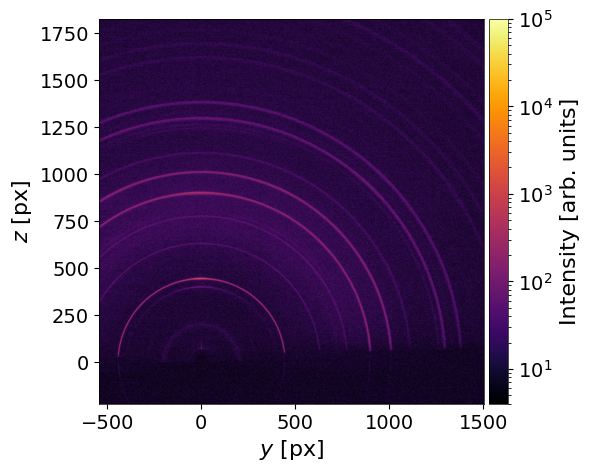
Plot the raw image with default parameters:
analysis.plot_img_raw(frame_num=0, clims=(4,1e5))
Visualization of Converted Images
Parameters
frame_num– frame to plot (int)clims–(vmin, vmax)for color scalereturn_result– return(x, y, img)ifTrueplot_result– display the plot (True/False)xlim,ylim– axis limits, e.g.,(0, 500)save_fig– save the figure (True/False)path_to_save_fig– path to save figure, default"img.png"
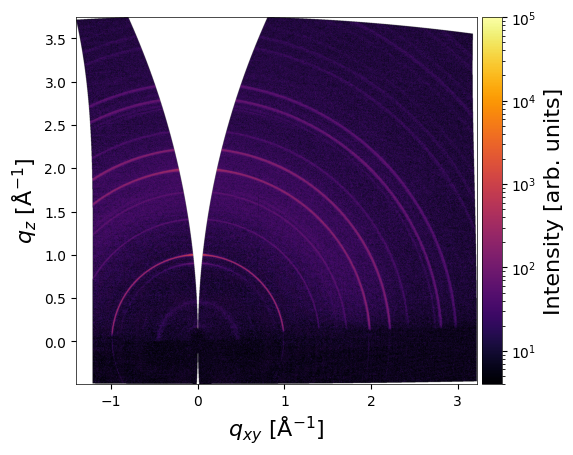
Convert the data to reciprocal space and plot the result with default parameters:
analysis.det2q_gid(plot_result=True, clims=(4,1e5))
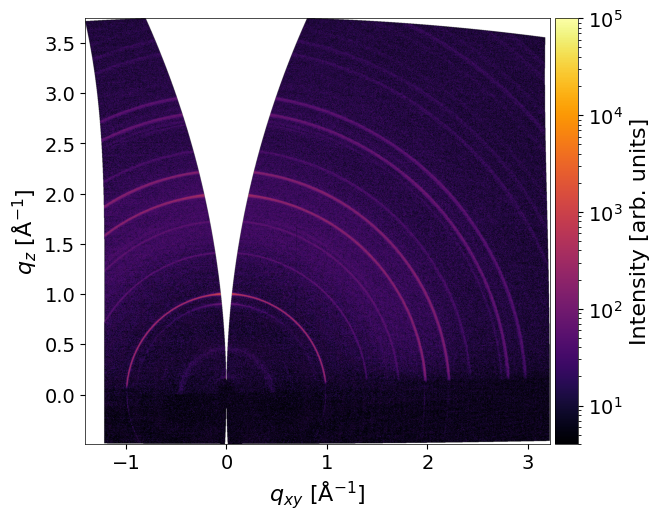
or separately
analysis.det2q_gid(plot_result=False)
analysis.plot_result(clims=(4,1e5))
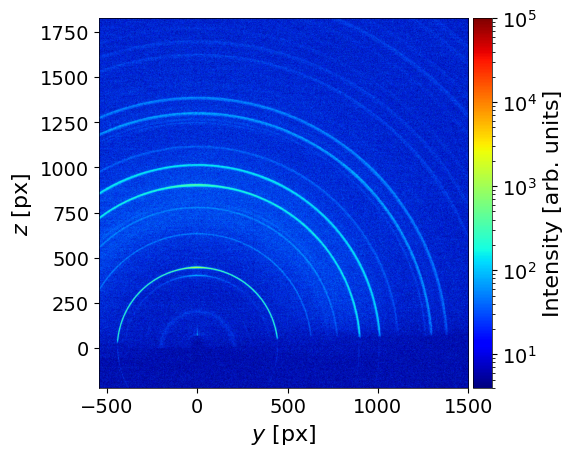
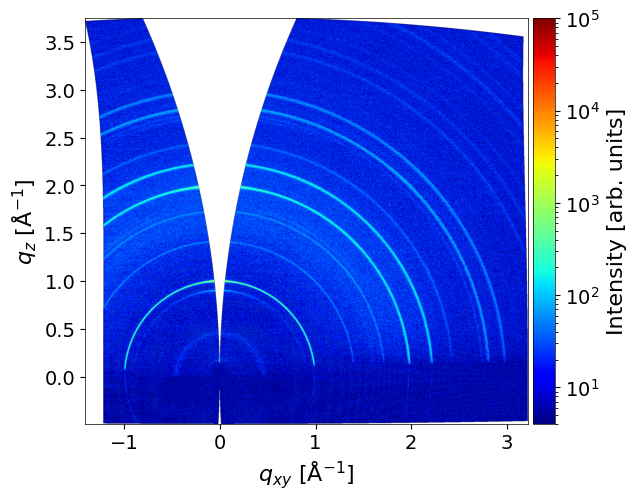
Change the default plotting parameters using set_plot_defaults function:
analysis.set_plot_defaults(cmap = 'jet')
analysis.plot_img_raw(frame_num=0, clims=(4,1e5))
analysis.plot_result(clims=(4,1e5))
Full list of adjustable parameters in set_plot_defaults
help(analysis.set_plot_defaults)
Help on method set_plot_defaults in module pygid.conversion:

set_plot_defaults(font_size=14, axes_titlesize=None, axes_labelsize=None, grid=False, grid_color='gray', grid_linestyle='--', grid_linewidth=0.5, xtick_labelsize=None, ytick_labelsize=None, legend_fontsize=None, legend_loc='best', legend_frameon=True, legend_borderpad=1.0, legend_borderaxespad=1.0, figure_titlesize=None, figsize=(6.4, 4.8), axes_linewidth=0.5, savefig_dpi=600, savefig_transparent=False, savefig_bbox_inches=None, savefig_pad_inches=0.1, line_linewidth=2, line_color='blue', line_linestyle='-', line_marker=None, scatter_marker='o', scatter_edgecolors='black', cmap='inferno') class method of pygid.conversion.Conversion
    Sets the default settings for various parts of a Matplotlib plot, including font sizes, gridlines,
    legend, figure properties, and line styles. The function configures the default style for future
    plots created with Matplotlib.

    Parameters:
    - font_size (int): Default font size for text elements (e.g., title, labels, ticks).
    - axes_titlesize (int): Font size for axes titles.
    - axes_labelsize (int): Font size for axes labels (x and y).
    - grid (bool): Whether or not to display gridlines (True/False).
    - grid_color (str): Color of the gridlines (e.g., 'gray', 'black').
    - grid_linestyle (str): Line style of the gridlines (e.g., '--', '-', ':').
    - grid_linewidth (float): Width of the gridlines.
    - xtick_labelsize (int): Font size for x-axis tick labels.
    - ytick_labelsize (int): Font size for y-axis tick labels.
    - legend_fontsize (int): Font size for the legend text.
    - legend_loc (str): Location of the legend (e.g., 'best', 'upper right', 'lower left').
    - legend_frameon (bool): Whether to display a frame around the legend.
    - legend_borderpad (float): Padding between the legend's content and the legend's frame.
    - legend_borderaxespad (float): Padding between the legend and axes.
    - figure_titlesize (int): Font size for the figure title.
    - figsize (tuple): Size of the figure in inches (e.g., (6, 6)).
    - savefig_dpi (int): DPI for saving the figure (higher DPI means better quality).
    - savefig_transparent (bool): Whether the saved figure should have a transparent background.
    - savefig_bbox_inches (str): Defines what part of the plot to save (e.g., 'tight' to crop extra whitespace).
    - savefig_pad_inches (float): Padding added around the figure when saving.
    - line_linewidth (float): Line width for plot lines.
    - line_color (str): Color of the plot lines (e.g., 'blue', 'red').
    - line_linestyle (str): Line style (e.g., '-', '--', ':').
    - line_marker (str): Marker style for plot lines (e.g., 'o', 'x').
    - scatter_marker (str): Marker style for scatter plots (e.g., 'o', 'x').
    - scatter_edgecolors (str): Color for the edges of scatter plot markers (e.g., 'black').
    - cmap (str): Image colormap
The default font size is 14 pt. By default, xtick_labelsize and ytick_labelsize are set to font_size, while axes_labelsize is set to font_size + 2. To override these defaults, specify xtick_labelsize, ytick_labelsize, and axes_labelsize explicitly.
analysis.set_plot_defaults(figsize=(5,5), xtick_labelsize=10, ytick_labelsize=10, axes_labelsize=16)
analysis.plot_result(clims=(4,1e5))